Insights / Tactical Analysis
Tactical AnalysisMonte Carlo simulations in sports: A simple guide
ParallaxEdge Research · May 20, 2026 · 9 min read
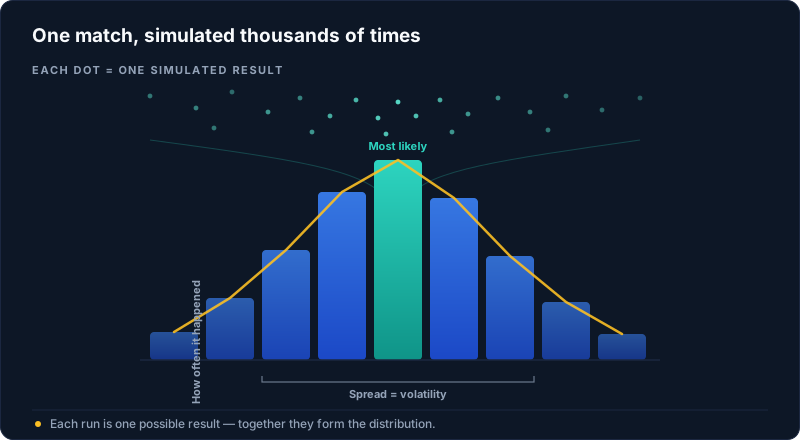
Ask most people to predict a match and they will give you a single scoreline. The trouble is that one scoreline is almost always wrong, and it hides the thing that actually matters — how the result could have gone. Football is low scoring and full of chance, so the same fixture played on two different days can end in very different ways. A forecast that commits to one outcome throws away that information.
Monte Carlo simulation is a way to keep that information instead of discarding it. Rather than asking the model for its single best guess, we ask it to play the match out thousands of times. Every run uses the same underlying team strengths, the same expected goals, and the same home advantage, but it lets chance fall differently each time, the way it does in real life.
A single run works like a very fast, very cheap version of the actual game. The model knows roughly how many chances each side should create and how good those chances are. From that it draws a plausible number of goals for each team, a little different on every run, and records who won. One run might finish 1 to 0 to the favorite. The next might finish 2 to 2. Neither is the answer. Both are simply possibilities the match contains.
The value appears when you stack all of those runs together. Count how often each result came up and you no longer have a guess — you have a distribution. You can see that the favorite won, say, 6,200 times out of 10,000, that the match was drawn 2,100 times, and that the underdog sprang a surprise on the remaining 1,700. Those counts become probabilities, and probabilities are far more honest than a single scoreline.
A distribution tells you two things at once. The first is the most likely outcome, which is just the tallest bar. The second, and the more interesting one, is everything around it. A forecast where one result towers over the rest is a confident forecast. A forecast where three or four results sit at almost the same height is the model telling you, plainly, that this match is hard to call.
We turn that shape into a single number we call volatility. A narrow, peaked distribution means the runs mostly agreed, so volatility is low and confidence is high. A wide, flat distribution means the runs disagreed a great deal, so volatility is high. This is why two matches with the same favorite can carry very different confidence. The headline probabilities can look alike while the spread behind them does not.
Picture two fixtures. In the first, a strong side meets a weak one at home. Most of the ten thousand runs end in a comfortable home win, and the distribution has a tall, clear peak. In the second, two evenly matched sides meet. The runs scatter across wins, draws, and narrow losses, and no single result dominates. The headline favorite might be the same in both, yet only the first is a match you can call with any conviction.
You might wonder why we run the match ten thousand times rather than a hundred. The answer is stability. With only a handful of runs, the rare outcomes either fail to appear or appear too often, and the probabilities jump around. As the number of runs grows, those estimates settle down and stop moving, so the distribution we publish is a steady picture of the match rather than a noisy one.
The most common mistake people make with any probability is to read it as a promise. A model that gives the favorite a 62 percent chance is not saying the favorite will win. It is saying that if this exact match were played many times, the favorite would come out on top in roughly 62 of every 100. When the other 38 arrive, as they will, that is not the model being wrong — it is the model being right about uncertainty.
Monte Carlo does not remove uncertainty. It measures it — a different and far more useful thing. It will not tell you what will happen in a single match. What it gives you is an honest map of what could happen and how likely each path is, and at ParallaxEdge we publish that map, spread and all, because the spread is part of the truth of the match.
Want deeper insights?
Join the waitlist for advanced simulations, full distributions, and model explanations.