Education / Stats Explained
Stats Explained·6 min read·Intermediate
xG vs Goals: Why They Diverge
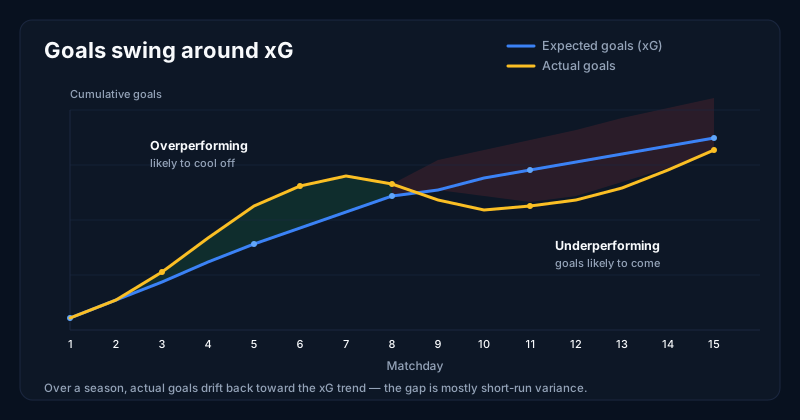
When a team's expected goals and its actual goals disagree, that gap is information about luck, skill, and what is coming next.
You already know that expected goals (xG) estimates how many goals the chances a team created should typically produce, while actual goals are simply what found the net. Here is the part that trips people up: over a single match, those two numbers routinely fail to match, and that mismatch is not a flaw in the model. It is information. A side can generate 2.0 xG and walk away with nothing, or scrape together 0.6 xG and win 2-0. Learning to read the gap between expected and actual goals tells you something the scoreline alone cannot, namely whether a result was earned by the run of play or borrowed from chance.
The first and largest source of divergence is finishing variance, which is a clinical way of saying luck. Goals are rare events, and rare events arrive in lumps. A team that creates 2.0 xG worth of chances will, across many identical performances, average two goals, but in any one game it might score zero, one, three, or four, all through perfectly normal randomness. This is the same reason a fair coin can land heads five times in a row without being rigged. Over two or three matches these swings are enormous and can completely invert what the underlying play deserved. Over a full season, though, the highs and lows wash against each other and actual goals drift back toward the expected total.
Not every gap is luck, however, and the way you tell them apart is sample size. Some players and teams outperform their xG year after year, and a smaller number persistently fall short. Because xG treats every shot as if an average player were taking it, a genuinely elite finisher will beat the model again and again, and that durability across hundreds of chances is the signature of real skill rather than a hot streak. The rule of thumb is simple: a gap over a few games is almost certainly variance, while a gap that survives a very large sample is pointing at something repeatable in the player or the system.
Goalkeeping is the mirror image of finishing and another reason actual and expected goals come apart. A goalkeeper in form suppresses the opposition below their xG, stopping shots an average keeper would concede. That has a sneaky consequence when you study defenses: a team with a low goals-against number but a high xG-against may not be defending well at all. It may simply be riding excellent goalkeeping, allowing dangerous chances and getting bailed out. The shots conceded say one thing, the goals conceded say another, and the gap between them often has a name standing on the goal line.
This is where the gap becomes genuinely useful rather than merely interesting. When results outrun the underlying numbers, when a team keeps winning while being out-chanced, it is usually a warning that the run is borrowing from luck and will not last. When the numbers outrun results, when a side dominates the xG battle but cannot buy a goal, positive regression typically follows and the goals start to come. This is why net xG across a season is one of the most stable predictors of future results: it strips out the short-run noise that raw goals carry and measures the chance-creation engine underneath. Goals tell you what happened; xG trends tell you what tends to happen next.
A fair caveat keeps all of this honest: xG is a powerful lens, not the whole picture. Game state shapes both the chances and the finishing, since a team chasing a deficit creates frantic xG while a team protecting a lead sits deep and concedes it. Red cards, tactical shifts, and the specific quality of who is on the field all bend the numbers, and a single match can diverge for entirely legitimate reasons. Treat the gap as a question worth investigating, never as a verdict. On ParallaxEdge, team pages chart xG-for and xG-against trends over time, so you can see at a glance whether a recent stretch of results reflects sustainable chance creation or a short-run finishing swing that is likely to even out.
Want the full Learning Center?
Join the waitlist for premium guides, worked examples, and downloadable reference sheets.