Education / Stats Explained
Stats Explained·8 min read·Beginner
What is xG? The Complete Guide
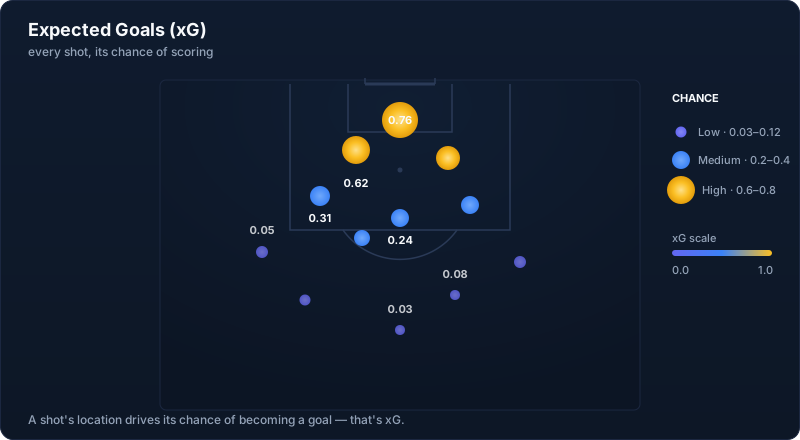
Understand how expected goals measures the quality of scoring chances, and why it predicts better than shots alone.
Expected goals, or xG, is a number assigned to every shot that estimates the probability it results in a goal. A shot with an xG of 0.30 is a chance that, based on thousands of historically similar shots, gets scored roughly 30 percent of the time. Sum the xG values across every shot a team took in a match and you get that team's xG total for the game. A side that finishes with 2.1 xG created chances that, on average, would yield about two goals. The actual scoreline might be 4-0 or 0-0 — xG describes the quality of what was created, not what the scoreboard happened to record.
The inputs that drive an xG model are mostly geometric and contextual. Shot location matters most: distance from goal and the angle to the posts together explain a huge share of the variance. Body part matters too — headers convert at far lower rates than shots with the feet from the same spot. Then come the situational variables: was the shot from open play, a cross, a corner, a through-ball, a rebound, a set piece? Was the shooter under defensive pressure? Was it a counter-attack with the defense out of position? Most models also carry a 'big chance' flag for one-on-ones and similar high-leverage situations. The whole machine compresses 'how good was this chance?' into a single number between 0 and 1.
This is why xG predicts future results better than raw shot counts. Imagine two teams that both registered 12 shots. Team A took 10 of theirs from outside the penalty area and two speculative efforts from 30 yards. Team B worked the ball into the six-yard box four times and had six more attempts from inside the area. Both lines read '12 shots' in the match report, but Team B created roughly twice the goal threat. Goals themselves are noisy on a single-match scale — a striker who converts one chance in ten will, occasionally, convert two in a game and look unstoppable, or miss six and look broken. xG smooths through that variance and gets at the underlying chance creation.
xG has real limits, and the honest version of the story names them. First, it doesn't measure finishing skill. Some players — Harry Kane and Erling Haaland are the usual examples — consistently outperform their xG across enough shots that the gap is almost certainly talent rather than luck. xG treats every shooter as league-average. Second, xG only sees shots that were taken. A well-organized defense that forces the opposition to recycle possession sideways and backward never lets a dangerous shot happen at all, so the defensive quality that prevented those chances doesn't show up in the xG-against column. Third, xG is a measure of shot quality, not a moral judgment about who deserved to win.
The companion number is xG against — the xG total of the shots a team conceded. Subtracting xG-against from xG-for gives a net rating that is, across a full season, one of the most stable predictors of how a team will perform the following season. Within a single match, plotting cumulative xG minute by minute produces the now-familiar 'xG race' chart: two lines climbing in steps, each step the size of a shot's xG value, that show when chances were created and which side had the better of the game in chance-creation terms. A flat line for thirty minutes followed by a sudden 0.6 jump tells a story the box score can't.
On ParallaxEdge, xG shows up in two places. Every fixture's Match Intelligence page surfaces expected goals for both sides, alongside the model's win-draw-loss probabilities. Team pages carry per-season xG-for and xG-against trends so you can see whether a side's recent results reflect sustainable chance-creation or short-run finishing variance. Under the hood, the Bayesian Dixon-Coles model that drives our World Cup 2026 win probabilities is fit on historical goals, and xG feeds into the per-fixture scoreline grid you see on every match page. The full methodology is published — if a team's projected strength looks wrong to you, you can see how the model gets there.
One caveat to close on. No single number captures a soccer match, and xG isn't trying to. A team can post 1.8 xG against 0.6 and still lose 1-0 to a goalkeeper having the game of his life, or to a deflection, or to a referee call — and none of that means the underlying performance was bad. xG is the single most-useful number we have for evaluating chance creation, and it belongs at the center of any analytical view of the sport. But possession structure, pressing intensity, defensive shape, passing networks, and set-piece routines all layer on top. xG is the foundation, not the whole building.
Want the full Learning Center?
Join the waitlist for premium guides, worked examples, and downloadable reference sheets.