Education / Modeling
Modeling·7 min read·Intermediate
What Is Dixon-Coles?
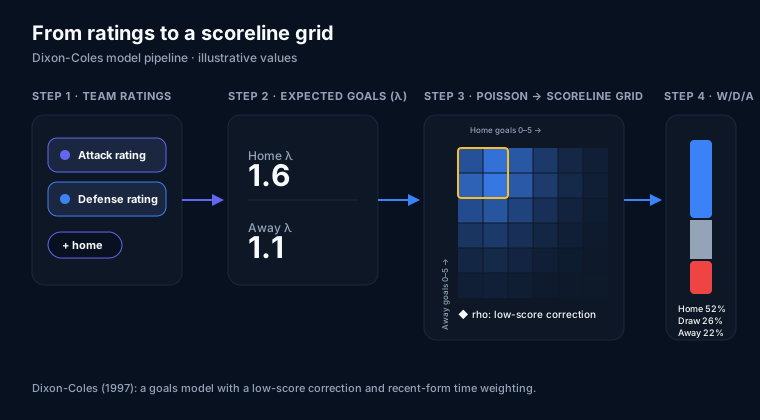
Dixon-Coles is the goals-based statistical model behind ParallaxEdge's match forecasts and tournament simulations, explained here in plain language.
Start with a deceptively simple idea: a soccer match is really two teams trying to score goals, so a good model should be built around goals. The classic approach gives every team two ratings, an attack rating that says how good they are at creating goals and a defense rating that says how well they prevent them. To forecast a specific game, you combine one team's attacking strength with the other team's defensive weakness, then add a small bump for the home side, since playing at home is worth something almost everywhere in the sport. The result is a single number for each team: their expected goals for this particular match, meaning the average number you'd expect them to score if you could replay the game many times.
That expected-goals number is not a prediction of the final score; it's the input to one. To turn an average like 1.4 goals into actual scoreline odds, the model uses the Poisson distribution, a standard tool for counting random events that happen at some steady rate. Feed it an expected-goals number and it hands back a full set of probabilities: the chance of scoring exactly zero, exactly one, exactly two, three, and so on. Do this for both teams and you have two separate goal distributions. Multiply them together across every combination and you get a grid of scoreline probabilities, where each cell is the chance of a specific result like 2-1 or 0-0. Sum the cells where the home team scores more, and you have a win probability; sum the diagonal where the scores are equal, and you have the draw probability.
This Poisson framework is elegant, but in 1997 two statisticians, Mark Dixon and Stuart Coles, noticed it had a blind spot, and the paper they published became the foundation of modern soccer modeling. Their first fix addressed low scores. Plain Poisson treats each team's scoring as fully independent, which slightly mis-handles the most common results in the sport: 0-0, 1-0, 0-1, and 1-1 show up more or less often than the basic model expects. Dixon and Coles added a correction, usually written with the Greek letter rho, that nudges the probabilities of exactly those low-scoring cells up or down so the grid matches what real matches actually do. It's a small adjustment, but those scorelines are so frequent that getting them right matters a great deal.
Their second refinement was about time. A model that treats a result from three seasons ago the same as one from last weekend will be slow to notice that a team has gotten better or fallen apart. Dixon and Coles introduced time weighting, which simply counts recent matches more heavily than old ones when fitting each team's attack and defense ratings. The effect is that the ratings track current form rather than ancient history, fading the influence of the past gradually instead of cutting it off abruptly. Together, the low-score correction and time weighting turn a clean textbook model into something that holds up against the messiness of real seasons.
It's worth being clear about why this approach fits soccer so well, and where it stops. On the strengths: it's built around goals, the actual currency of the game; it produces a complete distribution of scorelines rather than a single win-or-lose number, which is what makes a full results grid possible; and it's interpretable, meaning you can read a team's attack and defense ratings directly and understand why a forecast looks the way it does. That transparency is exactly why it's been a workhorse of football modeling for decades. The limits are just as real. The model speaks the language of goals, so it doesn't directly ingest expected-goals shot quality, possession, or tactical detail. It assumes the two teams' scoring is close to independent, and the rho correction only partly captures how they actually interact. And like any model, it is only as trustworthy as the data and the ratings it was fit on.
At ParallaxEdge, Dixon-Coles is the engine under the hood, with one important addition: we use a Bayesian version, which means we give the model sensible prior expectations that discipline the ratings and keep them stable when a team hasn't played many games yet. That piece is worth its own lesson, so we cover the priors separately. For now, the thing to carry with you is that this single family of ideas does a lot of visible work on the platform. Every scoreline grid you see on a match page is that two-team goal distribution made visual, and the tournament simulator runs the same machinery thousands of times over to estimate how a whole competition is likely to unfold. Once you can see the attack rating, the defense rating, and the goals model behind a forecast, the numbers stop being a black box and start being a story you can read.
Want the full Learning Center?
Join the waitlist for premium guides, worked examples, and downloadable reference sheets.