Education / Modeling
Modeling·5 min read·Intermediate
Understanding Brier Score
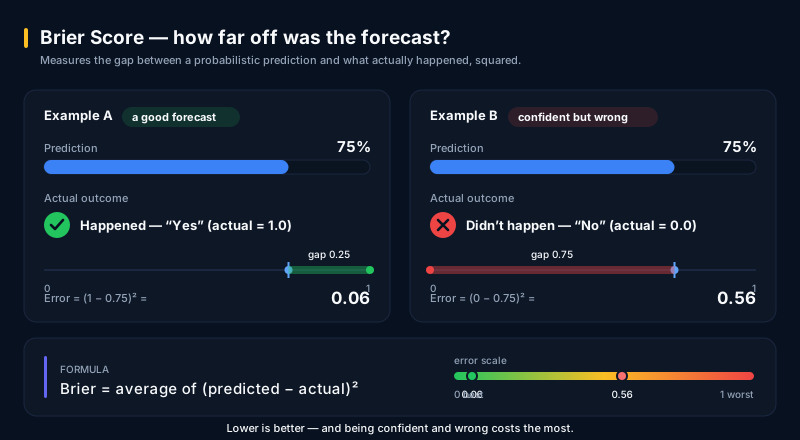
The standard measure of forecast accuracy, and how we use it to hold our models accountable in public.
A Brier score is the simplest honest answer to the question every probability model has to face eventually: when you said 70 percent, how often did that thing actually happen? It measures how far a probabilistic forecast lands from what actually occurred. Forecast a 0.70 chance the home side wins and they win, your error is small. Forecast 0.70 and they lose, your error is large. The Brier score is the average of those squared errors across every forecast you've ever published. Smaller is better, and the scoreboard is unforgiving in a useful way.
The math is plain. For each match, take your three forecast probabilities (home, draw, away), compare each one against the actual outcome coded as 0 or 1, square the differences, and sum them. Then average that sum across every match in your holdout test. A naive forecaster who assigns 1/3 to each outcome on every match lands at 0.667, the no-skill benchmark. A theoretical perfect forecaster who somehow assigns 1.0 to whatever happens, every time, scores 0. Every real probability model lives somewhere in between those two poles, and the question is where.
Brier is not the only option here. Log-loss is sometimes preferred during machine learning training because it has nicer gradient properties, and it punishes confidently wrong forecasts more harshly. But for public-facing accountability, Brier is the cleaner instrument. It penalizes forecasts that are uncalibrated and forecasts that are under-sharp at the same time. A timid forecaster who hedges with 0.40/0.30/0.30 on every fixture is wrong less spectacularly than a confident one, but is also far less informative, and Brier sees through that hedge in a way that simpler accuracy metrics never could.
Here is our actual number. The ParallaxEdge Bayesian Dixon-Coles model, evaluated walk-forward across recent international matches it never trained on, scores a Brier of about 0.31. On the 2022 World Cup specifically — held out so the model never saw it during fitting — it scores 0.3192. We report the Brier and the calibration rather than a single headline comparison: the honest claim is that the model lands close to what actually happened and that its stated probabilities behave like real probabilities, which is the entire argument for publishing the methodology in the open.
We deliberately do not dress that number up with a skill-score band or a percentage-better headline. A normalized skill score depends entirely on which no-skill reference and which Brier convention you pick, and mixing conventions is how forecasts end up overstating themselves. The honest summary is the one we publish: a Brier of about 0.31, out of sample, paired with a calibration check. It says the model is materially better than guessing and materially worse than perfect, which is the truthful description of any probability model that touches the real world.
The discipline we are committing to is that the running Brier score gets published, for every public forecast, refreshed as matches finish. Including the misses. When the model says 0.65 for a home win and the away side runs out 2-0, that miss raises our Brier, and the dashboard shows it. We will not quietly drop the forecasts that aged badly or rewrite the priors after kickoff. The single most informative thing about a probability model is how well-calibrated it stays under live conditions, and the only honest way to demonstrate that is to keep the scoreboard public.
One caveat worth stating clearly. Brier is a backward-looking measure. It rewards models that were already good across the matches you tested them on, and it penalizes models that were already bad. It does not promise that a model will stay good next month, next tournament, or against an opponent style it has not seen. We trust the 2022 World Cup holdout because it is the closest structural analog to 2026 we have access to, but if the live Brier across June and July diverges from the backtested one, we will be the first to publish that divergence and explain it.
Want the full Learning Center?
Join the waitlist for premium guides, worked examples, and downloadable reference sheets.