Education / Tournaments
Tournaments·7 min read·Intermediate
Simulating a Tournament: What 50,000 Runs Reveal
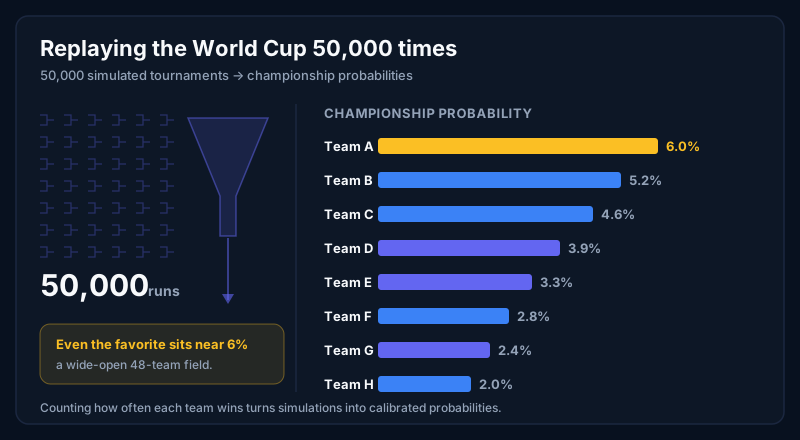
Instead of guessing one bracket, we play the entire World Cup fifty thousand times and read the patterns that emerge.
When you ask who will win the World Cup, the honest answer is not a single name but a distribution of possibilities. A 48-team tournament has billions of plausible paths from the group stage to the final, and any one bracket you might draw is almost certainly wrong. So instead of guessing one outcome, we use a technique called Monte Carlo simulation: we let the model play the whole tournament, start to finish, tens of thousands of times. In our case, fifty thousand complete runs. Each run is one imagined version of the World Cup, with its own group winners, its own upsets, and its own champion. The power comes not from any single run but from looking at all of them together.
Each simulated match is decided by the model's view of how that specific game might unfold. We use a Bayesian Dixon-Coles model, which produces a full scoreline distribution for any matchup rather than just a win probability. That means it has an opinion about whether a game is more likely to end 1-0, 2-2, or 3-1. For every match in a simulated run, we draw a scoreline from that distribution, the way you might draw a card from a weighted deck. Winners then advance through the real bracket structure: the Round of 32 feeds the Round of 16, then the quarterfinals, semifinals, and final. When a knockout match comes out level, the simulation resolves it the way the real tournament would, with extra time and, if needed, a penalty shootout.
The interesting part happens when you aggregate. After fifty thousand runs, every team has a record: how many times it won its group, how often it reached the quarterfinals, how frequently it played in the final, and how many times it lifted the trophy. Those counts become probabilities. If a team wins the title in 3,000 of the 50,000 runs, that is a championship probability of roughly 6 percent. What is striking about a 48-team field is how low even the top number sits. In our current run, the favorite lands around that same 6 percent mark, which is not a knock on the favorite but a statement about how genuinely open the tournament has become.
This approach is far more honest than simply naming a favorite and stopping there. A single prediction throws away everything interesting about a tournament: the underdog that catches fire, the group of death that eliminates a contender early, the path that opens up when a rival falls in the round before you meet. By replaying the bracket fifty thousand times, the simulation captures the full range of those paths, including the unlikely ones, and weights them by how often they actually occur. It also produces calibrated probabilities, meaning numbers you can check against reality later. And because more runs reduce random noise in the estimates, fifty thousand simulations give us figures stable enough to trust without burning resources on diminishing returns.
On the platform, everything you see in the World Cup simulator is drawn from that same fifty-thousand-run engine. The title odds tell you how often each team finished as champion. The group advancement view shows how reliably a team escaped its group. The knockout path tools let you trace how a team tends to reach each round and which opponents it most often runs into along the way. The upset tracking surfaces how frequently the lower-rated side won across all those runs, so a surprise result is shown with the actual probability the model assigned it rather than treated as pure chaos.
We also believe a forecast should be accountable, which is why we publish how the model performs on data it never trained on. Its out-of-sample Brier score is about 0.31, measured walk-forward across recent international matches (and 0.3192 on the held-out 2022 World Cup specifically), the Brier score being a standard measure of how close probabilistic forecasts land to what actually happened, where lower is better. Putting that number in the open lets you judge the model on its track record rather than its confidence. Taken together, the simulator is not a crystal ball promising one outcome; it is a way to see the entire shape of the tournament, the favorites and the long shots alike, expressed in probabilities you can read, compare, and ultimately hold to account.
Want the full Learning Center?
Join the waitlist for premium guides, worked examples, and downloadable reference sheets.