Education / Stats Explained
Stats Explained·6 min read·Intermediate
Reading the Confidence Gauge
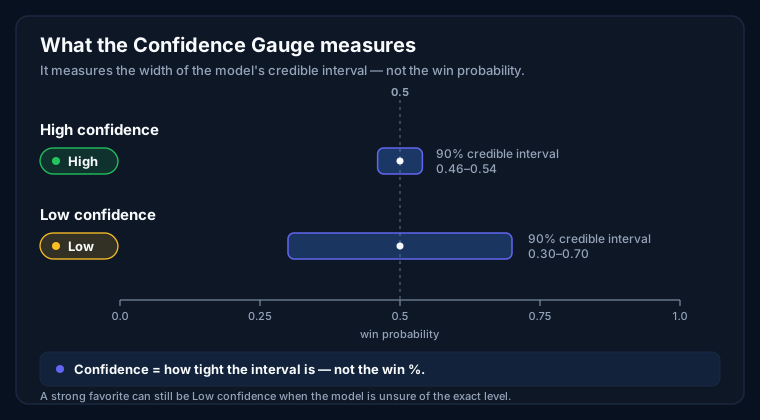
The Confidence Gauge isn't the favorite's win probability — it's a separate score for how sure the model is about its estimate.
The single most common mistake fans make on a Match Intelligence page is reading the Confidence Gauge as the favorite's chance of winning. It isn't. If the gauge reads 78, that does not mean the favored team wins 78 percent of the time. The Confidence Gauge is a separate measurement on its own 0-to-100 scale, paired with a plain-language label of Low, Medium, or High. It answers a completely different question than the win probabilities do, and once you see what that question is, the gauge becomes one of the most useful numbers on the page.
What the gauge actually measures is how sure the model is about its own estimate. Every projection the model makes carries some uncertainty, and the gauge captures the size of that uncertainty. Specifically, it is derived from the width of the 90 percent credible interval around the favored outcome's probability. When that interval is narrow — say the model places the favorite's win probability somewhere between 0.46 and 0.54 — it is confident it has the level pinned down, and the gauge returns a High score. When the interval is wide — say 0.30 to 0.70 — the model is admitting it isn't sure where the true number sits, and the gauge returns a Low score. Tighter range, higher confidence; wider range, lower confidence.
It helps to know what a credible interval is in plain language. It's a Bayesian range that says, “there's a 90 percent chance the true probability lies somewhere in here.” A single point estimate — one tidy number like “53 percent” — looks authoritative, but it hides how much wiggle room sits behind it. The credible interval pulls that hidden uncertainty into the open. A range of 0.46 to 0.54 is the model saying the truth is almost certainly close to a coin flip. A range of 0.30 to 0.70 is the model saying the truth could be anywhere from a clear underdog to a clear favorite. Same midpoint, wildly different stories.
Here is the insight that trips people up the most: you can have a strong favorite and low confidence at the same time. These are two different axes. The win probability tells you who the model favors and by how much; the confidence gauge tells you how firmly it holds that view. A team can be the clear favorite while the model remains genuinely unsure exactly how large the gap is — which happens when there's little data on an opponent, when the matchup is volatile, or when the few signals available are pulling in different directions. A high probability paired with low confidence is not a contradiction. It's the model being honest about the limits of what it knows.
That's why the gauge is meant to be read together with the win probabilities, not instead of them. The headline percentages tell you the who and the how-much. The gauge tells you how much to trust that read. Picture two fixtures that both show a 55 percent favorite. On paper they look identical. But if one carries a High confidence score and the other carries Low, they are not the same call at all — the high-confidence fixture is the steadier read, where the model is comfortable with its number, while the low-confidence one is a projection you should hold more loosely. Two axes, read together, give you a far richer picture than either could alone.
This is exactly why the Confidence Gauge sits directly beside the win probabilities on every Match Intelligence page. The layout is deliberate: the two numbers are designed to be taken in as a pair, because each one is incomplete without the other. Next time you open a match, resist the urge to glance at a single figure and move on. Read the probability to learn what the model thinks, then read the gauge to learn how sure it is — and let the distance between those two answers shape how much weight you give the projection.
Want the full Learning Center?
Join the waitlist for premium guides, worked examples, and downloadable reference sheets.