Education / Modeling
Modeling·6 min read·Intermediate
Is the Model Calibrated?
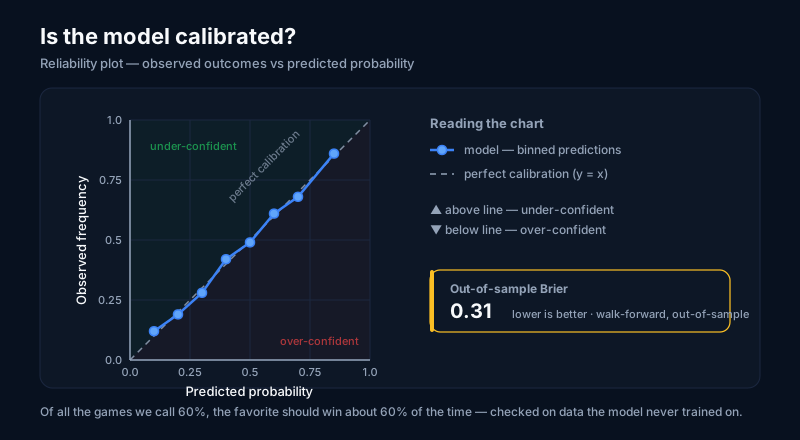
A calibrated model is one whose probabilities mean exactly what they say, so a stated chance is a real chance.
Calibration is a simple idea hiding behind a technical word: a model is calibrated when its probabilities mean what they say. If our model looks at a batch of matches and tells you “60% home win” for each of them, then across all those matches the home team should actually win about 60% of the time. Notice what this is not about. It is not about whether any single prediction turned out “right,” because a 60% call that loses is not a mistake, it is one of the four-in-ten times the favorite was supposed to fall. Calibration is about the honesty of the numbers as a group. It asks whether a stated probability is a trustworthy probability, not whether the model is clairvoyant.
This is why calibration matters more than raw accuracy. Anyone can predict that a dominant team will beat a weak one, and a model that only ever forecasts blowouts can rack up an impressive-looking hit rate while telling you nothing useful. The hard part, and the valuable part, is the middle and the margins: the 30% underdogs, the genuine 50-50 coin flips, the 70% favorites. A calibrated model is one where all of those levels hold up over many games. When that happens, a number like “62%” stops being a vague vote of confidence and becomes something you can actually reason with, because it behaves like a real probability rather than a gut feeling dressed up as one.
The standard way to check this is a calibration plot, sometimes called a reliability plot. You gather every forecast the model has made, sort them into buckets by their stated probability, and then for each bucket you compare two things: what the model predicted on average, and what actually happened. Plot predicted on one axis and observed on the other, and a perfectly calibrated model traces the 45-degree diagonal, where predicted always equals observed. Points sitting above the line mean the model was under-confident, since reality came in higher than it claimed; points below the line mean it was over-confident, claiming more certainty than the results justified. The shape of that curve tells you, at a glance, exactly where the numbers can be trusted and where they drift.
If you want a single number, the Brier score is the usual summary. It blends two qualities at once: calibration, the honesty just described, and sharpness, the willingness to make confident, decisive forecasts instead of hedging toward the middle. Our out-of-sample Brier score is about 0.31, measured walk-forward across recent international matches the model never trained on, and with the Brier score lower is better. But a single number can paper over real problems, because a model can post a respectable Brier while still being systematically over-confident in one region and under-confident in another, with the errors partly canceling out. That is precisely why we treat the reliability plot as the essential complement: the score gives you the headline, the plot shows you whether the story underneath holds together.
A large part of why our probabilities stay honest comes from the Bayesian approach behind the model. Regularization, in the form of priors that gently shrink extreme team ratings toward more reasonable values, keeps the model from being seduced by small samples and lucky streaks. Left unchecked, a model will happily declare a team nearly unbeatable on the strength of a few results; the priors pull those extremes back, and the direct, measurable effect is better calibration. The probabilities come out less overconfident and closer to the diagonal. We cover the Bayesian machinery itself in a separate lesson, but the connection is worth stating plainly here: the discipline that improves calibration is the same discipline that makes the ratings sensible in the first place.
We publish this because a forecast you can audit is a forecast you can trust. Calibration is always checked on data the model never trained on, since in-sample everything looks flattering by construction and the only real test is held-out data, which is why our score is measured walk-forward across matches the model never saw during fitting. We put that out-of-sample number in the open so the model is judged on its track record rather than on our confidence in it. One honest caveat deserves to stand alongside it: calibration is a property measured across many games, never a verdict on any single one. A well-calibrated model will still see plenty of its individual long shots come in and its favorites fall, and any single check on a small sample is noisy by nature. The promise is not that the model is right every time; it is that, over the long run, its numbers tell the truth.
Want the full Learning Center?
Join the waitlist for premium guides, worked examples, and downloadable reference sheets.