Education / Stats Explained
Stats Explained·4 min read·Beginner
How to Read Our Match Intelligence Page
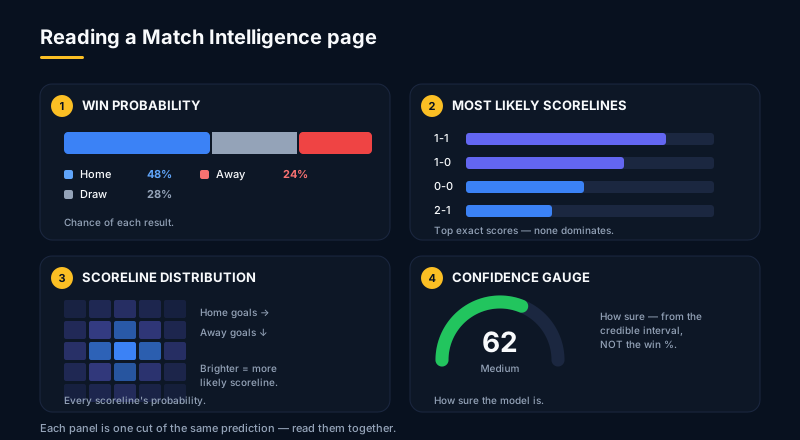
A guided tour of probabilities, scoreline distributions, the confidence gauge, and the factors panel.
When you open a Match Intelligence page, you land on the Overview tab with a stack of panels showing what the model thinks about a single fixture. The team crests and kickoff time sit at the top, the tab bar underneath opens focused views (Probabilities, Scorelines, Team Analysis, xG & Stats, Simulation, Insights), each a deeper cut of the same prediction. The Overview tab — everything below the tab bar — is the at-a-glance version, and this tour walks each of its panels top to bottom so the page reads quickly the next time you visit.
Start with the Win Probability card. Three percentages, always summing to 100: home win, draw, away win. This is the marginal probability of each result before you look at any specific score. Right below it, the Key Insight card translates those numbers into one deterministic sentence, naming the favorite and the expected-goals picture, for example France are favored at 48%, projected to outscore Iraq 1.4-0.9 on expected goals. Same numbers, just read aloud.
Next comes Most Likely Scorelines, the top five exact scores ranked by probability. You will often see 1-1, 1-0, 0-1, 0-0, and 2-1 near the top of a tight match. Notice that even the most likely scoreline rarely cracks 15%. Soccer spreads its probability mass across many possible final scores, so no single scoreline ever dominates. The bars give you a feel for how flat or concentrated that distribution is for this particular fixture.
The Scoreline Distribution heatmap below it shows the full picture: a 6 by 6 grid covering every score from 0-0 up to 5+-5+. Each cell's color intensity tracks the probability of that exact scoreline. Read the diagonal for draws, the lower-left for home wins, the upper-right for away wins. Most of the mass clusters near the center because most matches end with both sides scoring once or twice. Blowouts live in the corners and stay pale.
The Confidence Gauge is the panel most people misread. It is not the favorite's win probability. It is a separate 0 to 100 score with a Low, Medium, or High label, derived from the 90% credible interval around the favored outcome's probability. A narrow interval like 0.46 to 0.54 earns High confidence. A wide interval like 0.30 to 0.70 lands at Low. You can have a strong favorite and still see Medium confidence when the model is uncertain about the exact level.
Why this prediction? lists the factors driving the lean, things like Attacking edge or Defensive matchup, each with a signed percentage-point impact and a one-sentence explanation grounded in the projected xG. Attacking edge +6.2 means that factor shifts the home win probability up by 6.2 points. These are interpretive readings, not a strict SHAP decomposition, so they sum approximately rather than exactly. Use them to understand why the model leans the way it does, not to recompute the headline yourself.
At the bottom, the model card names the version, Bayesian Dixon-Coles, and shows when the projection was last updated. Probabilities refresh daily as new data arrives, so that timestamp tells you how fresh the read is. The tabs along the top — Probabilities, Scorelines, Team Analysis, xG & Stats, Simulation, and Insights — open focused views that regroup and expand these same numbers: Probabilities and Scorelines enlarge the panels you just read, Insights gathers the Key Insight and the factors, Team Analysis profiles each side, and xG & Stats adds derived numbers like expected goals, over/under, and both-teams-to-score. The Overview you have just read is the at-a-glance summary that ties them together.
Want the full Learning Center?
Join the waitlist for premium guides, worked examples, and downloadable reference sheets.